Reports: tabs, filters and exports
The figure tab bar, venue, period and source filters, What changed, the detail behind each figure, Excel export and the monthly summary.
Aggiornato il
A venue's revenue often lives in three files: inquiries in the mailbox, signatures in a sales spreadsheet, realized revenue in the accounts. Each one dates things its own way, and nobody lands on the same total.
The "Reports" page computes everything from the inquiries, events and quotes already in Joinways. A tab bar shows the period's inquiries, sales, confirmed revenue and clients at a glance, then operations. The same filters apply everywhere, every figure opens on click, three tabs export to Excel and a monthly summary goes out by email.
What you'll learn
- Read the figure tab bar and what each of the five tabs contains.
- Choose the period, the comparison, and the venues and sources shown.
- Open "What changed", a figure's definition and the list of events or inquiries it counts.
- Read the "like-for-like venues" comparison and the comparable workspaces medians.
- Export a tab to Excel, manage the monthly report email and ask the agent about your figures.
Prerequisites
- Reports are included in every plan, Free included.
- Role: "Owner", "Admin", "Member" or "Read-only". The "Operations" role has no access to reports, which show revenue.
- Goals are set with the "Owner" or "Admin" role.
- Inquiries and events in Joinways. A confirmed event's revenue comes from its confirmed amount, otherwise from the accepted quote, otherwise from the amount sent by the platform.
1. Open the reports and read the tab bar
Click "Reports" in the left menu. The page reopens the last tab you viewed, "Inquiries" the first time. The "Goals" button sits at the top right. Below it is the filter row: "Venue", "Period", "Compare to", "Source", then "What changed" and "Export". The tab bar comes next.
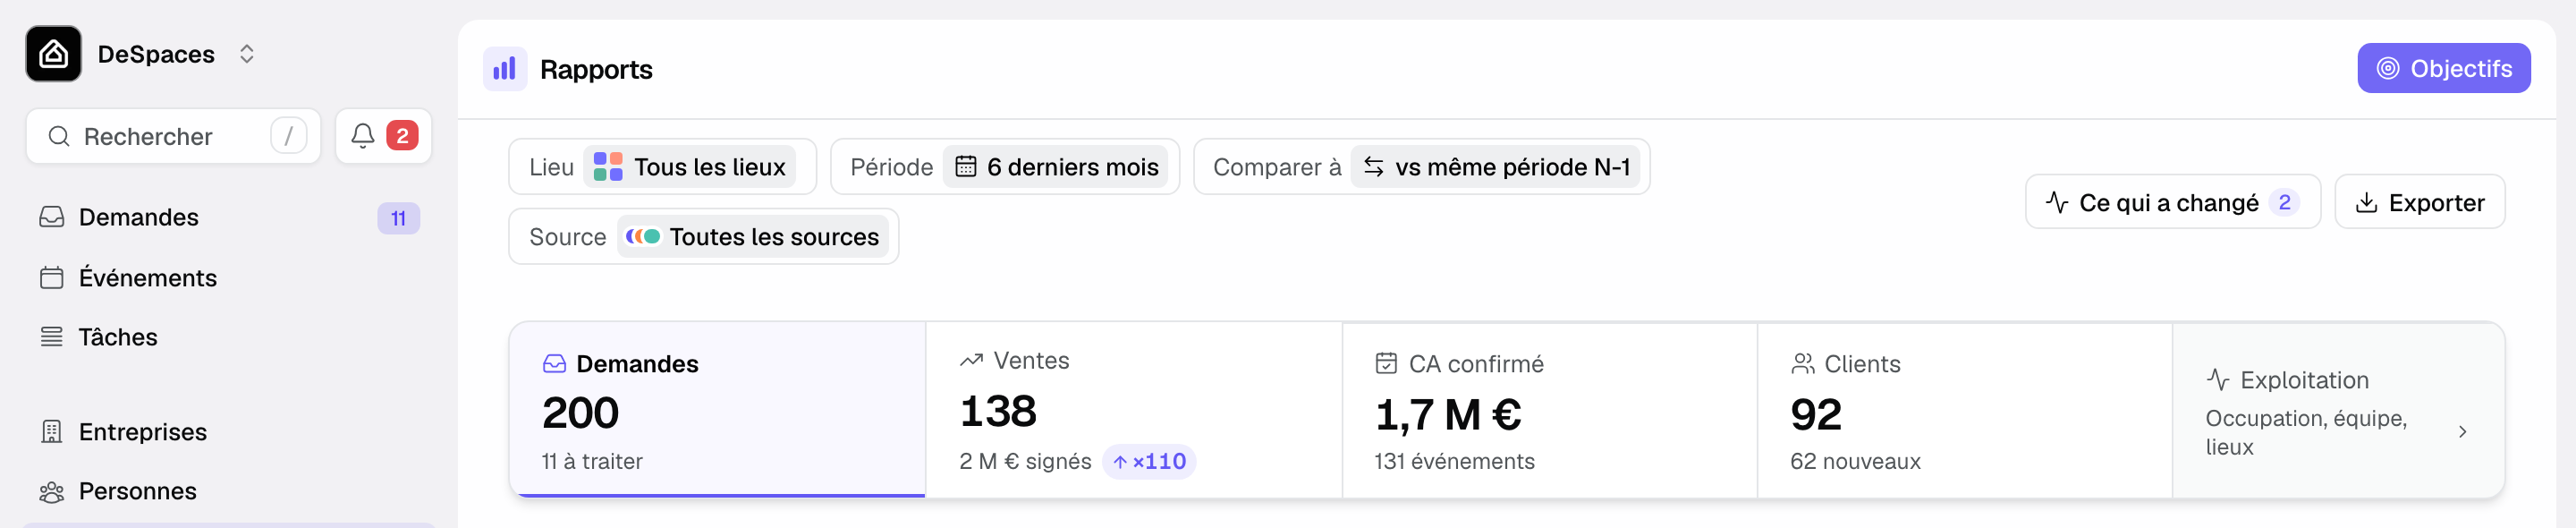
Each tab shows its main figure for the period, with the change badge when a comparison is chosen. Each one ranks figures by a single date:
- "Inquiries": inquiries received and how many to handle, dated when received. See The Inquiries tab.
- "Sales": the number of signatures and signed revenue, dated at signature. See The Sales tab.
- "Confirmed revenue": revenue of confirmed events and their number, dated on the event day. The tab also holds the month's revenue, the trend over 12 months and 3 ahead, and the year's outlook. See The Confirmed revenue tab.
- "Clients": clients who came in the period and new ones. See The Clients tab.
- "Operations": "Occupancy, team, venues", without a figure. See The Operations tab.
Good to know: the former tabs were merged. "Overview", "Activity" and "Finance" are now in "Confirmed revenue", "Responsiveness" and "Occupancy" in "Operations", "Platforms" in "Sales". An old link, including to the "Commercial" and "Accounting" views, opens the tab that replaces it.
2. Choose the period and the comparison
Click "Period" to pick a range: "Current month", "Last 3 months", "Last 6 months" (default), "Last 12 months", "Current year", "Last year", "All data" or "Custom". In "Confirmed revenue", "Clients" and "Operations", the period can also reach into the future with "Next 6 months" and "Next 12 months".
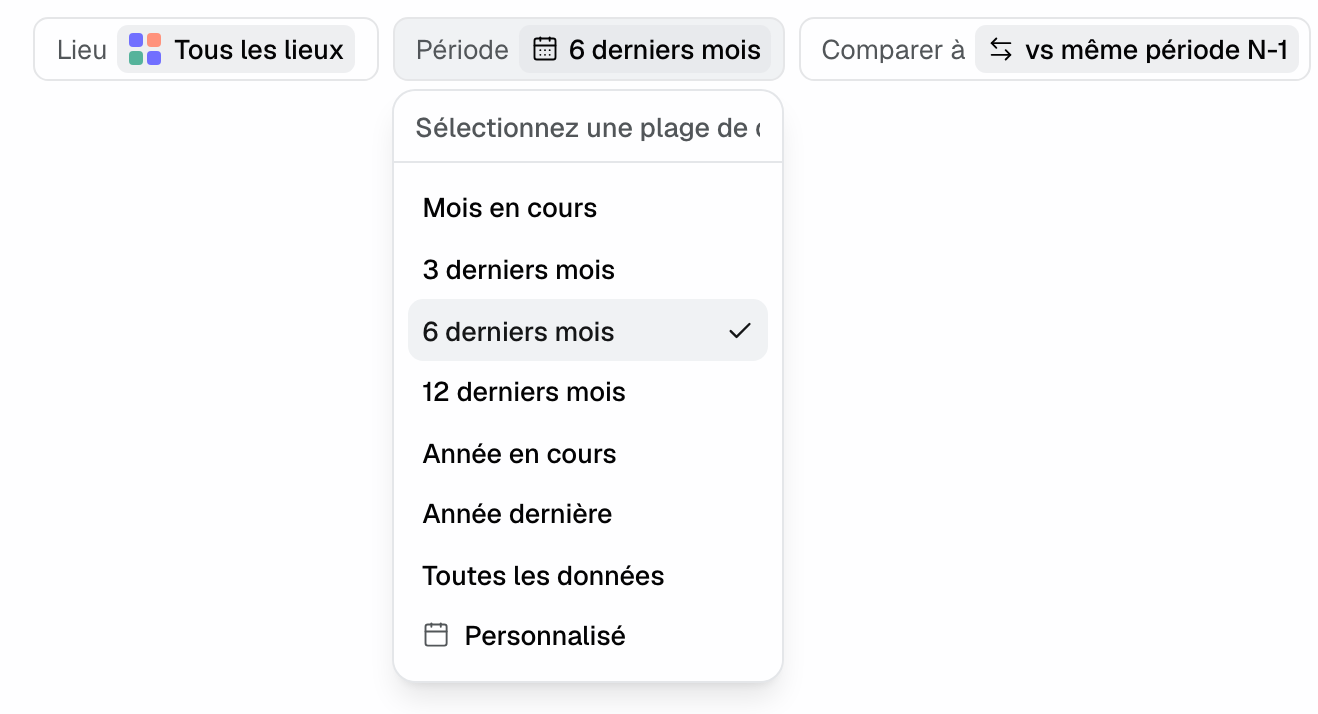
"Compare to" sets the reference for changes: "vs same period last year" (default), "vs previous period" or "No comparison". The change badges, in the tab bar and next to the figures, follow it. When the comparison period predates your data in Joinways, the change is hidden and a note explains why.
3. Filter by venue and by source
With several venues, "Venue" keeps only some of them. Tick the venues you want: the tab reloads once you stop selecting, and the selection follows you when you switch tabs. With a single venue, the filter and the "By venue" tables do not appear.
"Source" narrows reports to one or more arrival channels: platforms, direct inquiries, phone… The menu lists the period's sources with their number of inquiries and their color, the same in every chart. "All sources" removes the filter.
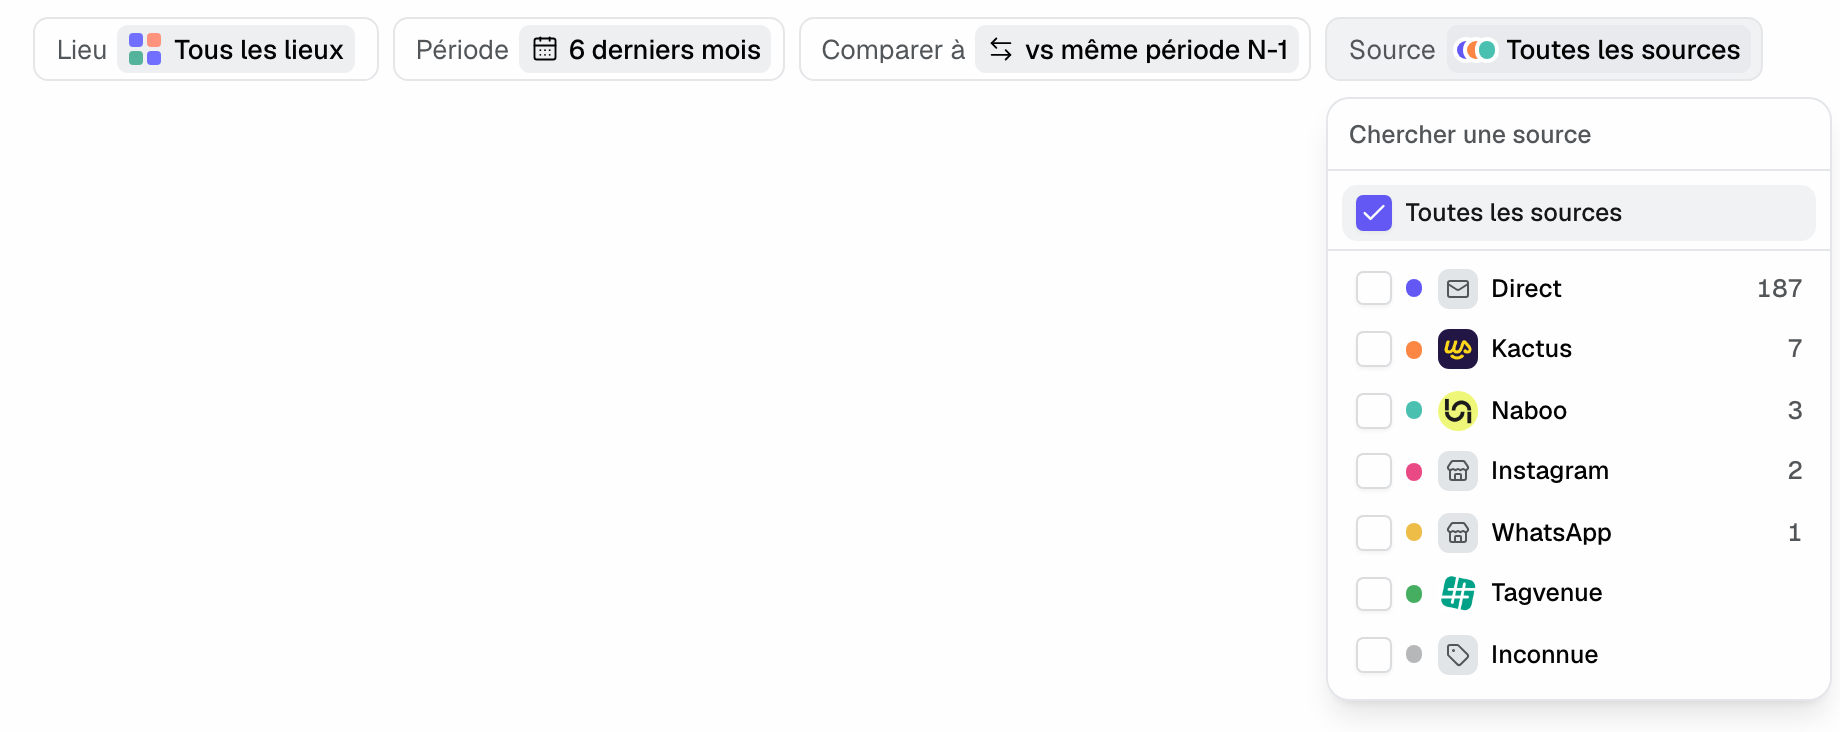
The Source filter applies to every tab, the tab bar, figure details and the export. In a by-source table, clicking a source name filters on that source alone. Under a Source filter, goals and comparable workspaces medians are not shown: they cover all revenue.
4. Read "What changed"
The "What changed" button, in the filter row, shows the current number of findings. It opens a side panel with up to three findings, compared with your last 12 months. They are computed from your data, never written by AI, and each must pass a volume threshold to appear:
- a venue carrying at least 40% of the month's signed revenue gap against last year, when that gap reaches 10%;
- a source whose inquiries over the last 30 days differ by at least 25% from its 12-month average (8 inquiries at least);
- a venue whose 90-day conversion differs by at least 10 points from its 12 months (8 closed options at least);
- a first reply time multiplied or divided by 1.5, by at least 30 minutes.
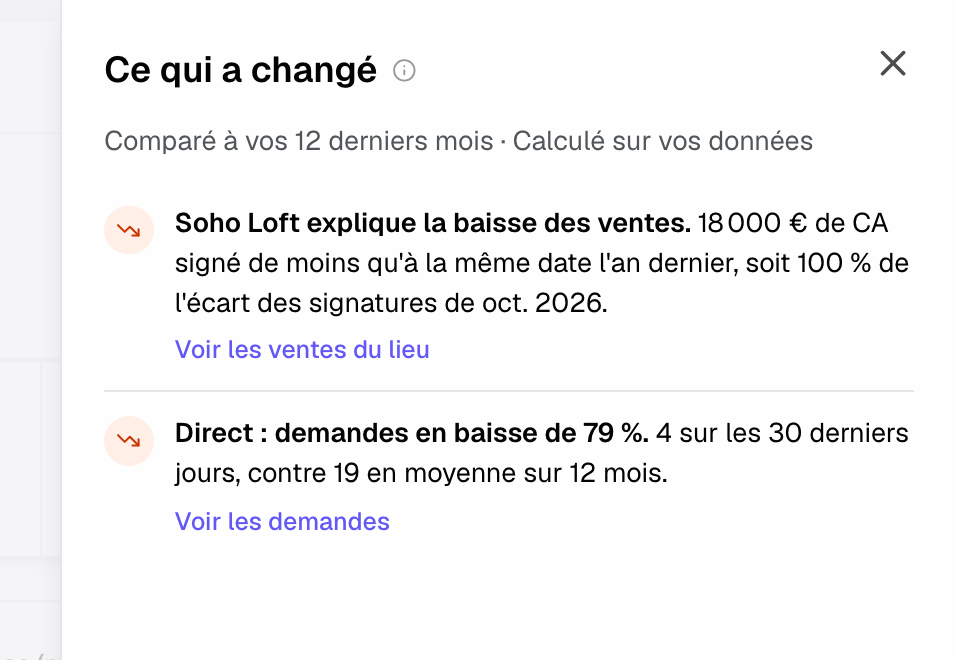
Each finding links to the tab that details it, for example "See the venue's sales" or "See inquiries". Findings follow the venue and source filters, not the period. With no notable change, the panel says your metrics stay within their averages.
5. Read a figure and open its detail
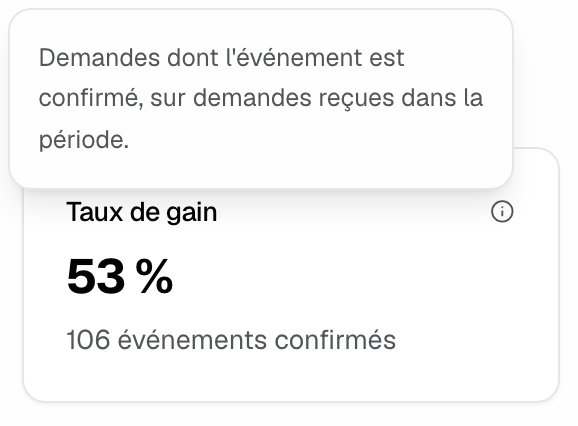
Every card has an information icon. Click it to read the exact definition of the figure: what is counted, on which date, and what is left out.
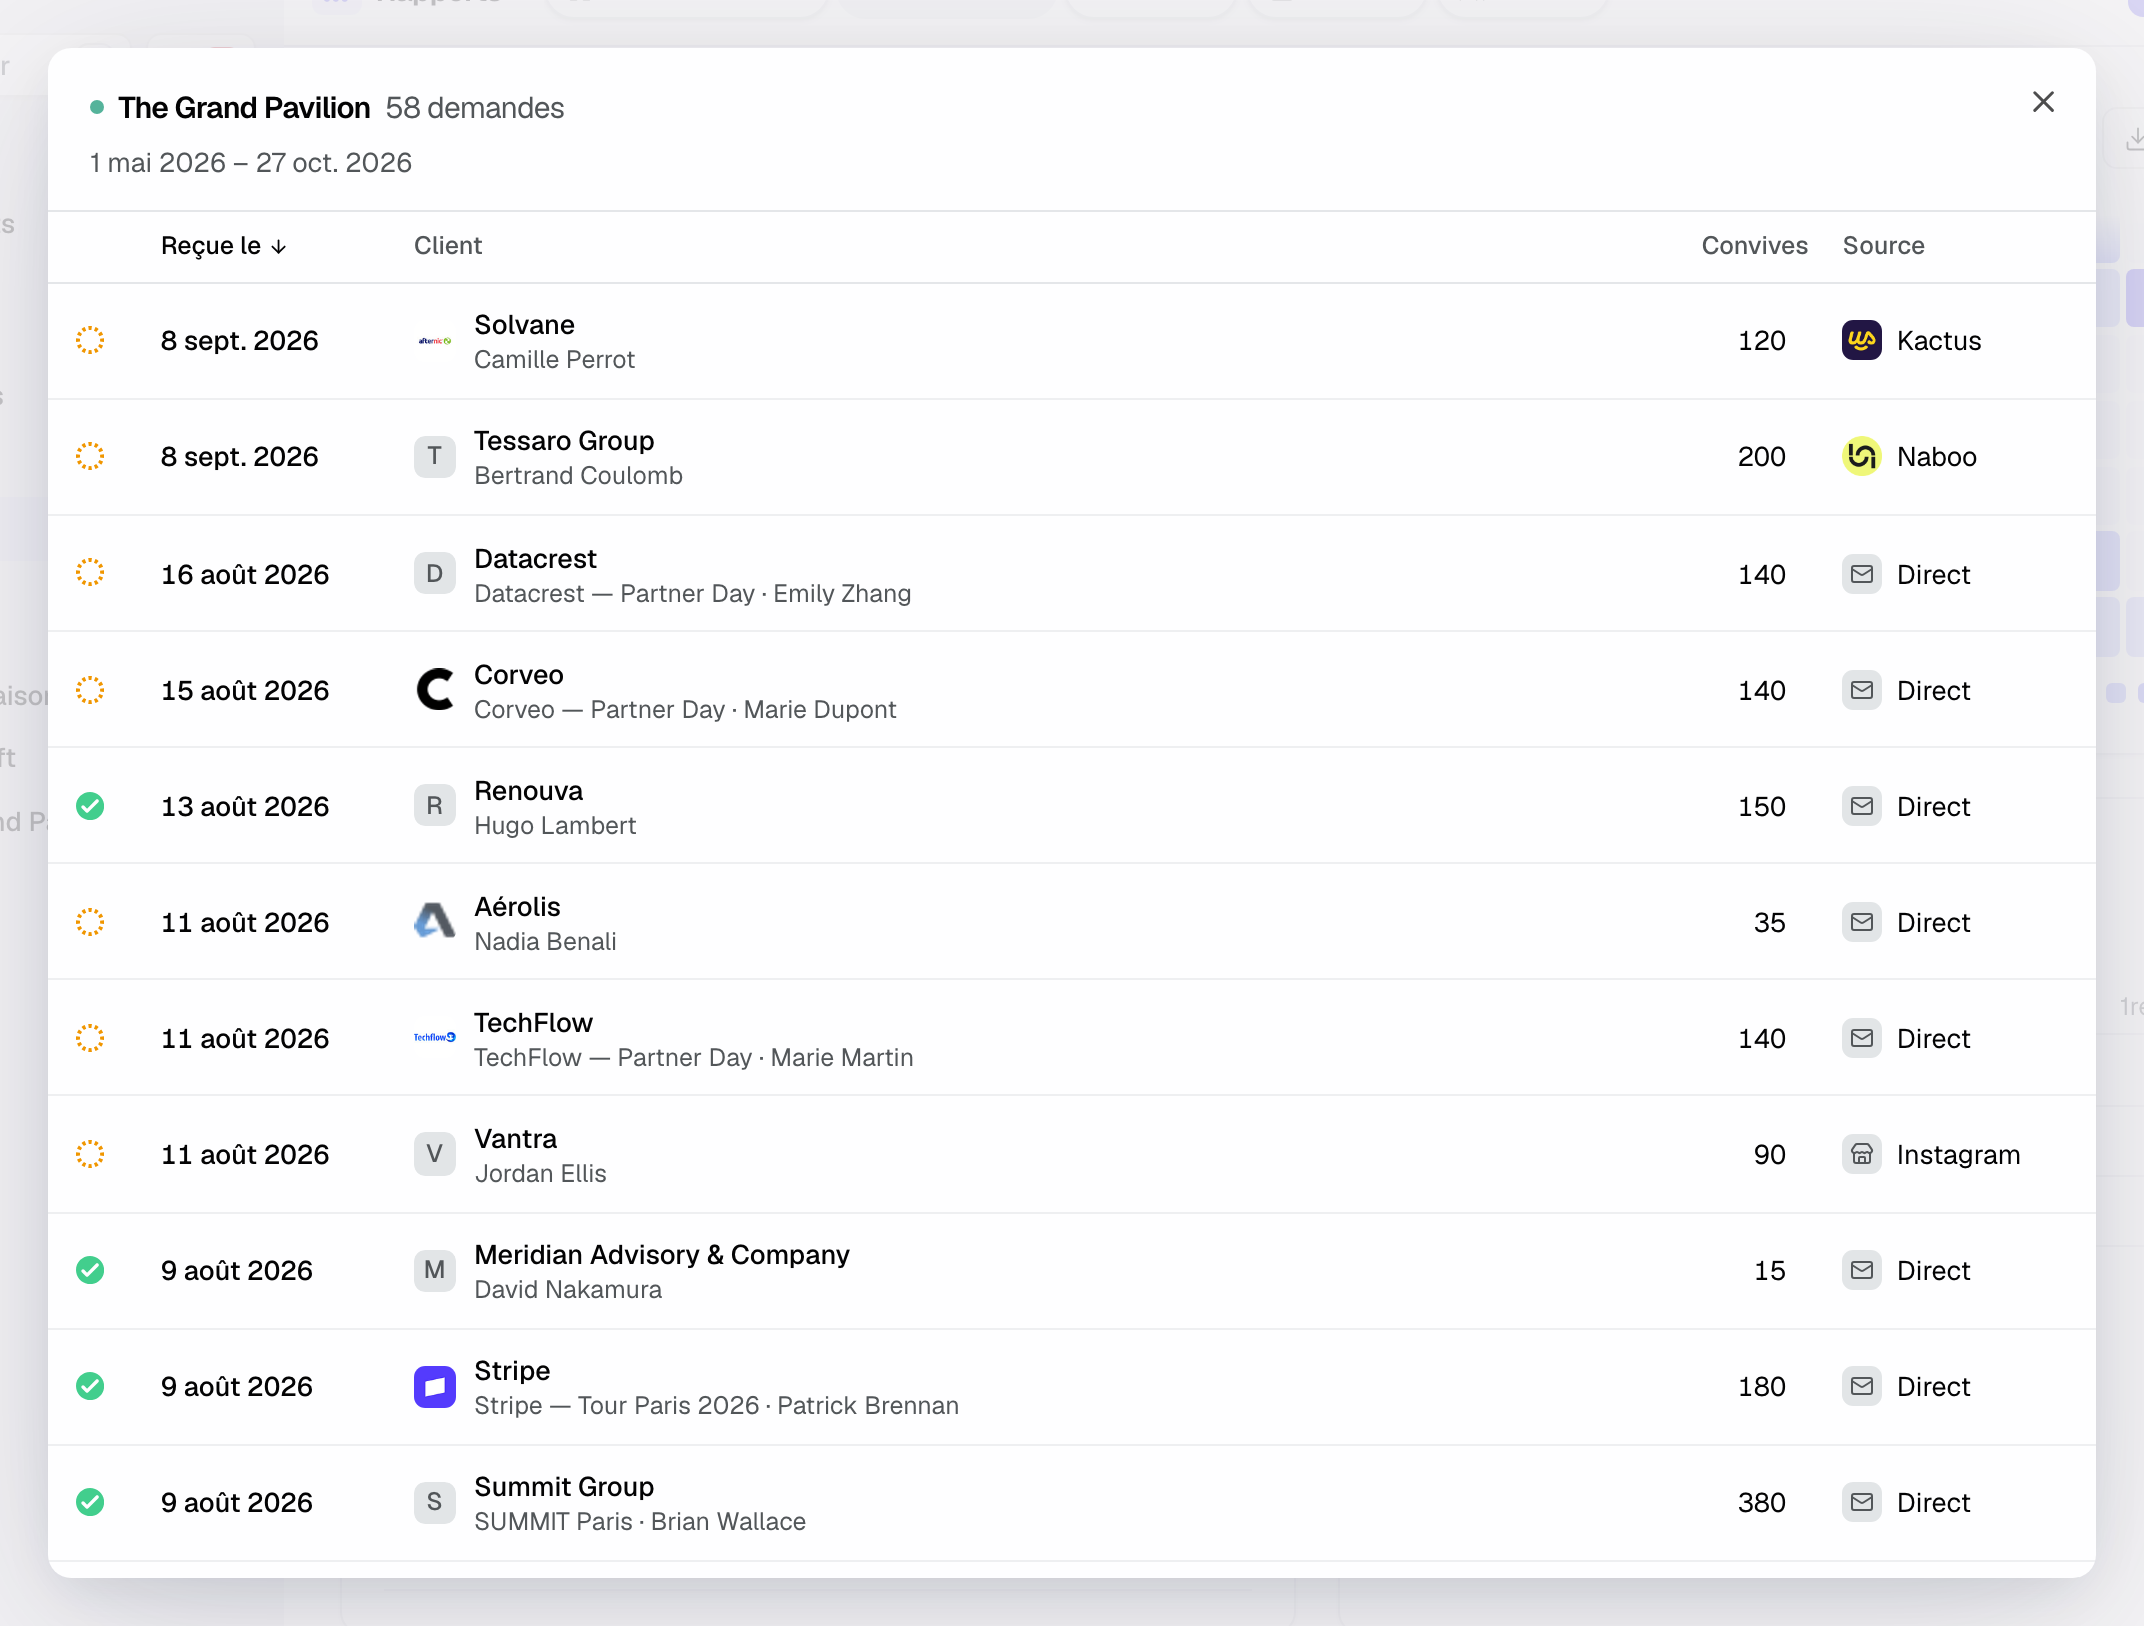
A figure with a dotted underline is clickable. It opens the list of events or inquiries it counts, with the date, client, guests, venue, source or amount depending on the case. Click a column header to sort, then a row to open the event or the inquiry in the inbox.
Long tables show their first rows; "Show N more" expands the rest. Figures update on their own when an event, inquiry or quote changes, at most once every 30 seconds.
6. Compare with comparable venues
Two comparisons share this idea, and they do not say the same thing:
- "Like-for-like venues", on the monthly revenue card of the "Confirmed revenue" tab: the year-on-year change without venues that opened or closed since. Their revenue is shown separately, so a new venue does not inflate growth.
- "comparables: …", in the "Profitability by source" table of the "Sales" tab: the median win rate of at least 10 subscribed workspaces of similar volume, over 12 months, rounded. It only appears once that threshold is met and disappears under a venue or source filter. It is never a single workspace's value.
7. Export to Excel
"Export" downloads the current tab as an Excel file, with the chosen period, venues, sources and comparison. A first sheet records the workspace, the tab, the period, the filters and the export date. The button is available on "Inquiries", "Sales" and "Confirmed revenue":
- "Inquiries": "Summary", "By month", "By source", "By venue", "Venue × source", "Processing by member", "Inquiries detail".
- "Sales": "Summary", "By month", "By venue", "By source", "By type", "Team", "Loss reasons", "Open options".
- "Confirmed revenue": "Summary", "By month", "By venue", "Venue × month", "By type", and the current year's "outlook".
8. Receive the monthly report by email
At the start of each month, Joinways sends last month's summary to the workspace owner and to the members who can access reports. The email covers signed and realized revenue, inquiries received, the 12-month win rate, the median time to first reply, the leading venues, inquiry sources and what changed. The month's sales detail is attached as an Excel file, and a button opens the month's report in Joinways. The summary always covers all venues and all sources.
To stop receiving it, go to "Settings" > "Notifications" and turn off "Monthly report". This setting is personal: it changes nothing for other members.
9. Ask a question about your figures
For a specific question ("which venue signed the most in September?"), ask the Joinways agent. It reads the same figures as the reports and answers in the conversation, with your role's permissions. See The Joinways agent.
Troubleshooting
"Reports" does not appear in the menu
Cause: your role is "Operations", which has no access to revenue. Solution: ask an admin to switch your role to "Member" or "Read-only" in "Settings" > "Teammates".
The "Goals" button is missing
Cause: only the "Owner" and "Admin" roles set goals. Solution: ask them to enter the goals, or to change your role.
Figures are lower than expected
Cause: a venue or source filter is on, or some confirmed events have no amount (the note showing revenue calculated on X of Y confirmed events says so). Solution: check "Venue" and "Source"; fill in the amount of the confirmed events concerned, reachable from the note.
"Export" is not offered
Cause: "Clients" and "Operations" cannot be exported. Solution: open "Inquiries", "Sales" or "Confirmed revenue".
"No change shown"
Cause: the comparison period predates your data in Joinways, or has no known amount. Solution: choose "vs previous period" or a more recent period.
Frequently asked questions
Where did the Overview go?
The figure tab bar replaces it. The monthly revenue card, upcoming bookings and the 12-month trend are in "Confirmed revenue". What needed action is in its own tab: "Unanswered" in "Inquiries", "Prepare follow-ups" in "Sales", the coverage note for confirmed events without an amount.
Are the figures updated in real time?
Yes. A change to an event, inquiry or quote reloads the open tab, at most once every 30 seconds. A browser tab left in the background updates when you come back.
Why does revenue differ between "Sales" and "Confirmed revenue"?
"Sales" ranks an event on the day it is signed, "Confirmed revenue" on the day it takes place. A wedding signed in March for September counts in March in "Sales" and in September in "Confirmed revenue".
Are amounts excluding tax?
Yes, every amount in the reports excludes tax.
See also
- The Inquiries tab: volume, conversion and sources
- The Sales tab: signatures, options and profitability by source
- The Confirmed revenue tab: monthly revenue, trend and outlook
- The Clients tab: loyalty, new clients and win-backs
- The Operations tab: occupancy, team and venues
- Goals, forecast and win probability
- The Joinways agent: ask, prepare, confirm
- Set up your notifications
Provalo sulle tue prossime richieste per 30 giorni, senza carta.